


Melon pipelines and flat volumetric rates
What sets the price for electricity delivery?


Welcome back to The Power Trip! For any new readers, in this series I attempt to translate — from utilityspeak into English — a decade of experience designing and researching electricity rates. We explore electricity rates to better understand the barriers to rapid decarbonization and learn how to advocate for removing those barriers.
One last plug: if you would like to support as a paid subscriber, all proceeds go towards an awesome organization called Run on Climate working to enact bold climate policy at the local level. Paid subscribers will have access to bonus content, Q&A, and a concierge service where we’ll step through your bill to identify ways to save money and cut carbon.
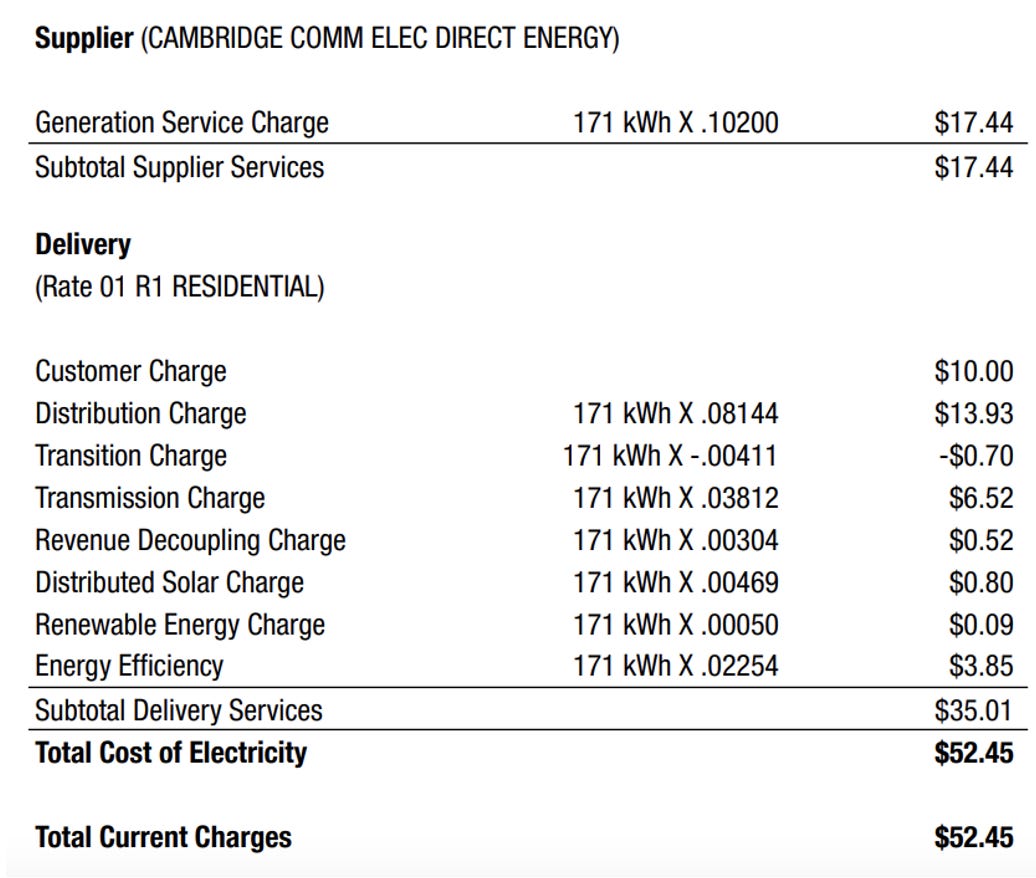
In the last post we reviewed each of the nine charges on my electricity bill. Here’s that bill once again in case you were feeling separation anxiety:
In this post, we start to explore the vital question: how are these charges determined? First we’ll isolate the charges that take up the lion’s share of the bill. We’ll then discuss what sets the price for transmission and distribution. Along the way, I’ll try to convince you that under the current pricing structure, we are all getting ripped off.
Which charges matter most?
We love our charges equally, but they can’t all have the spotlight. Figure 1 below shows the breakdown of total expenditure by category. Here I have grouped the distributed solar, renewable energy, and energy efficiency charges into a “policy” category. These charges don’t contribute to keeping the lights on but are instead designed to achieve policy goals, namely reducing electricity consumption and expanding deployment of renewable energy. While the exact percentages differ by utility, it’s almost always the case that the transmisison, distribution, generation, and customer charges constitute the top 4.
Here’s a quick refresher on what those charges represent:
Generation: electricity production in power plants, wind farms, etc (AKA melon cultivation)
Customer charge: connection to the grid (AKA annual Costco membership)
Transmission: sending electricity from generators to a hub in your town (AKA long distance melon transport)
Distribution: sending electricity from a hub in your town to your house (AKA short-distance melon transport)

Among those top 4 on my bill, all but 1 (the customer charge) is proportional to electricity consumption in the month. This is known as a flat volumetric charge: flat because it is the same price 24/7, and volumetric because it is based on the total volume of consumption. If I consume 200 kWh in a month, I’ll pay twice as much for generation, distribution, and transmission as if I consume 100 kWh. Yet (and here’s the key) the costs underlying those charges depend on other factors besides total monthly consumption.
The connection between flat volumetric charges and their underlying costs is a lot like a salad bar. The restaurant pays a different price for each ingredient, then sets a single price (let’s say $8/lb) based on how much of each ingredient they expect an average customer to select. Once that price is set for the day, a customer that fills their plate with 1 lb of walnuts (for which the restaurant pays $15/lb) will pay exactly the same at checkout as one that constructs a 1 lb salad out of cheap iceberg lettuce and croutouns (for which the restaurant pays $1/lb).
So if not total consumption, what drives the price for electricity? What separates the lettuce from the walnuts?
How do we pay for the poles and wires?
First, we’ll dive into transmission and distribution (known in utility parlance as “T&D”), leaving the customer charge & generation for a later post. We’ll cover T&D together since the concepts are identical, just operating at different scales. Remember way back to post #1. The transmission and distribution charges cover the cost of building and operating the network of poles, wires, and power electronic equipment to get electricity from generators to homes and businesses. Reprising our favorite melon analogy, transport charges might reflect the cost of gasoline, the cost of labor for a melon truck driver, and the cost of a delivery truck spread over its many trips. Over the whole industry, these costs grow with the number of melons delivered. But electricity is different. Electricity can move long distances over wires. So instead of a fleet of melon delivery trucks, imagine a melon pipeline. OK fine, because you asked nicely I’ll imagine one for you:

This magical pipeline connects melon growers with supermarkets and has a capacity of delivering 1 million melons per day. As long as there is available pipeline capacity, the cost to deliver an additional melon is zero. But if the pipeline reaches its maximum capacity (exceeding 1 million melons per day) then the pipeline will need to be widened, and the costs of that project will be passed on to all supermarkets (and ultimately to melon buyers).
Just like our melon pipeline, the cost of the electricity grid depends largely on its maximum delivery capacity, or in English: “the size of the wires.” The grid is built for the worst case scenario, which in many parts of the US means the hottest day of the year in the hour when lots of people return home and turn on their air conditioners. The electricity demand during this hour is known as peak demand. For thousands of hours in the year (during mild days, during overnight hours when people are sleeping or burning calories on a dancefloor, etc), there is extra capacity, since all of the infrastructure designed for peak demand stays put, with the same capacity all year round. During these hours there is virtually no cost associated with pushing an additional unit of electricity through the network.1
To calculate flat volumetric T&D charges, utilities essentially add up all the money they have invested in building out these networks to handle peak demand (plus forecasted maintenance and repair costs) and divide by the total expected annual consumption. The results are the preposterously long, 5-decimal place numbers you see on my bill — about 8 cents per kWh for distribution and 4 cents per kWh for transmission. What drives up the cost of transmission or distribution is when electricity demand approaches the wires’ capacity and the network needs to be expanded, either by upgrading existing lines or building new ones. We’ve arrived at the next critical question.
Does a flat volumetric charge properly signal to grid users when demand nears capacity? Spoiler alert: No
[Pew pew sound to signify teleporting back into melon world] Under a flat volumetric charge, the supermarkets would pay the same price per melon regardless of whether the melon pipeline is empty or nearly clogged. Let’s assume that weekends are the busiest times for melon purchases due to the bevy of picnics, barbeques, and other melon-intensive activities. Refrigeration is expensive and melons spoil easily on the shelf, so supermarkets want to draw from the pipeline on weekend days to match expected purchases. Figure 3 shows the daily aggregate supermarket melon demand and the (fixed) capacity of the pipeline.

Now imagine a new supermarket opens, connects to the pipeline, and asks for 200 melons on Sundays. The combined Sunday demand will be higher than the pipeline capacity. That means the costly upgrade will get triggered, an upgrade all supermarkets will all ultimately pay for in the form of higher flat volumetric rates in the future. Oh no!

How can we improve on a flat volumetric charge?
No supermarket likes this outcome. But even if we had explained the dilemma to them in advance, there is very little they could have done; a flat per melon delivery charge provides no information to the supermarkets that the pipeline is in danger of exceeding capacity. We could simply cap the number of melons each supermarket is allowed to take from the pipeline each day, but curtailing freedom is verboten in the melon industry. So how can we do better without mandates?
Notice that outside the weekend, the pipeline has lots of unused capacity.

We need some way to incentivize the supermarkets to shift their consumption away from the congested weekend period and towards the beginning of the week. One option: charge a low price for melon delivery during weekdays and a high price on weekends. Supermarkets with extra space in their stock rooms could save money by buying melons during these low-price days and refrigerating them on-site before putting them out for the weekend buying frenzy. Or they may offer a special deal on melons to nudge customers to buy them earlier in the week and keep them in their own refrigerators or move the neighborhood melon eating contest to a Wednesday.
Enough about the melons! How does this relate to electricity?
While electricity and melons don’t usually mix well, here the fundamentals are the same. It’s difficult to shift electricity demand across many days, but there is plenty of potential within the same day. Figure 6 shows electricity demand on the New England transmission grid during the week in which the 2022 peak demand occured (August 4th at 6pm). The blue area is the actual demand, and the orange area is the spare capacity (since the transmission grid is built to handle peak demand). Moving even a small amount of the electricity usage from the demand “mountains” in the early evening (above the red lines) to the daytime “valleys” (circled in green) would have translated into tens of millions of dollars of transmission charge savings enjoyed by all New Englanders.2 But most New England customers face flat volumetric rates, so they had no incentive to shift!

This phenomenon becomes even more pronounced when we zoom out from the peak demand week. Figure 7 shows New England region-wide demand from June through September 2022. Again here, the orange area is extra capacity on the transmission grid. When we think about the opportunity of electrifying millions of cars and heating systems, this orange area is critical because it can be filled without requiring expensive system upgrades. But that won’t happen under flat volumetric rates!

Where do we go from here?
Instead of flat volumetric charges, how could we structure a rate to encourage more electricity consumption during those valleys? And what type of electricty consumption is even capable of being moved? Those will be our main questions for next time!
If you take nothing else away from this post, just remember that while most of us pay for transmission and distribution based only on our total monthly consumption (that’s the definition of a flat volumetric charge!), the costs incurred by utilities to transmit and distribute electricity do not depend on total monthly consumption. Instead, they depend primarily on the maximum capacity (“the size of the wires”) at each level of the network, which in turn depends on peak demand. And finally, any price structure that changes based on the conditions of that network is more informative than a flat volumetric charge. See you soon!
For the electricity experts, please kindly permit the simplifications made in this paragraph.
Another simplification. Post in the comments if you want the full deep dive on transmission and capacity market cost allocation.